


A closer look into “money kicks”
Lipinski’s kicks inside 50 might lead to the highest proportion of marks, but do they also lead to the most goals?

IMAGE: AFL Photos
A big thanks to James Ives for his assistance with key parts of the coding for this piece
Last week Michael Whiting published an article on afl.com.au looking at each team’s “money man” – the players that lead the league for kicks inside 50 that result in a mark by a teammate.
Armed with numbers provided by Champion Data, Whiting looked at the top 11 players that have the highest percentage of “money kicks” across the AFL – which, if you didn’t see the article when it was published prior to the start of Round 16, was Collingwood’s Patrick Lipinski – as well as each club’s number one player for this particular statistic.
As Whiting correctly points out, “[the money kick is] the most important kick of the game – the one that’s delivered inside 50 to give your team its best chance of scoring”.
However, not all kicks inside 50 – even the ones that lead to a mark – are created equal, and Whiting has only scratched the surface of exploring the data behind the “money kick”.
Let’s take a deeper dive into this topic, using data from the top 10 players after Round 16. This list is essentially the same as the one Whiting presented in his article, save for Brisbane’s Hugh McCluggage and Melbourne’s Jake Melksham dropping out and Port Adelaide’s Darcy Byrne-Jones coming in.

How long are the “money kicks”?
The average “money kick” among the 10 players listed in the table above travels 36.3 metres. Therefore, it isn’t surprising to see that most players have an average “money kick” length somewhere between 32 and 40 metres. Hawthorn’s Karl Amon is the only player to be significantly above average, with an average “money kick” length of 47 metres.
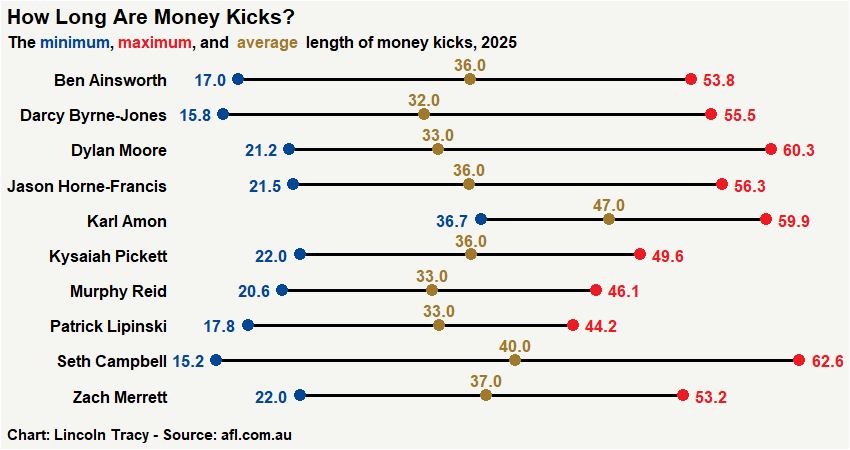
And while Amon is also up there in terms of the longest “money kicks” we have seen in 2025, that honour goes to Seth Campbell. The 20-year-old Richmond forward found Tom Lynch inside 50 with a 62.6 metre kick in the second quarter of the Tigers’ clash against the Western Bulldogs in Round 15. Unfortunately for him, Lynch absolutely shanked the kick, skying ball across the face of goal to Tim English, who took an uncontested mark.
The length of the kick is only one part of the equation, however. How far the ball travels matters less if it puts the recipient in a challenging position to do something impactful, such as scoring a goal. But more on this later.
What kind of mark is taken?
There are four different kinds of marks taken by players on the receiving end of the “money kick”: contested mark, pack mark, mark on lead, and uncontested mark. Here are the official Champion Data definitions for each type of mark, where available:
Contested Mark: When a player takes a mark under physical pressure of an opponent or in a pack.
Lead Mark: An uncontested mark taken after outsprinting an opponent.
Uncontested Mark: Marks taken under no physical pressure from an opponent. Includes marks taken on the lead and from opposition kicks.
Based on the definitions above, we can simplify marks as either contested (including pack marks) or uncontested (including marks on the lead).
As we can see from the graph below, the overwhelming majority of “money kicks” – a whopping 83.4% across the top 10 players – lead to uncontested marks. This makes complete sense when you think about the context of the “money kick”, which, by definition, results in a mark. And it’s much easier to take an uncontested mark than a contested mark.

However, it’s interesting to see that there is still a reasonable amount of variance between the top 10 “money kickers”. Dylan Moore’s “money kicks” have all resulted in uncontested marks, while roughly one-third of Ben Ainsworth’s “money kicks” were directed towards a contest.
I would be curious to see how the contested versus uncontested mark percentages changed when a player from the opposing team marked the ball from kicks travelling inside forward 50. I imagine that things would flip, and that there would be more contested marks than uncontested, as it seems far more likely that an intercept mark would occur among a pack of players. A topic for another day, perhaps.
What is the end result of the “money kick”?
A possession chain starts when a team takes possession of the ball, and it continues until the team in question no longer possess the ball (e.g., as a result of scoring, the ball going out of bounds, turning the ball over, or a ball up being called). Kicks inside forward 50 and the subsequent marks form part of a possession chain.
A high-level look at the data suggests Whiting was on the right track with why “money kicks” are so important. The largest proportion possession chains involving a “money kick” this year have resulted in a goal (64, 40.8% of all “money kick” possession chains), with a behind the next most common outcome (55, 35.0%). Turning the ball over (22, 14.0%), scoring a rushed behind (10, 6.4%), or having a ball up or an out of bounds call (3 each, 1.9%) are less common.
And while Patrick Lipinski might be leading the league with respect to the highest proportion of “money kicks” this season, the Magpie finds himself in the middle of the pack in terms of the possession chain ending in a goal. Lipinski’s 36.8% sits more than 15% behind first year Docker Murphy Reid’s 53.8%, who has a slight edge over Port Adelaide’s Jason Horne-Francis, Hawthorn’s Karl Amon, and Essendon’s Zach Merrett.
