


Last year I asked which journalist had the best strike rate at picking the best-performing players in a particular AFL game. Their strike rate was defined by how often the players that received coaches’ votes also appeared in the list of “best” players in their match reports that were published on afl.com.au.
Josh Gabelich had the highest strike rate among the journalists who covered at least 10 games (92.6%), ahead of Nathan Schmook (86.1%), Dejan Kalinic (86.0%), Michael Whiting (85.6%), and Riley Beveridge (85.2%).
But this definition of strike rate only tells us how often the journalist’s picks were endorsed by the coaches. It doesn’t tell us whether they captured the coaches’ full view of the best performing players, or whether they were able to identify the players the coaches rated most highly.
It was limited by the fact that I considered performance over the course of the entire home and away season, rather than looking at the data on a game-by-game basis.
So, for this year’s piece, I’m using a wider set of metrics to explore how closely each journalist gets to the coaches’ assessment over the course of the season. This allows me to look at a different set of questions of the two datasets. I’m also calculating how the journalists performed on each metric for each individual game before averaging performance over the course of the season.
The heart of this piece remains the same, however. I’m interested in exploring how “accurate” journalists are when it comes to whether the “best” players they listed in their match report also receive coaches’ votes. This can be visualised by the Venn diagram below.
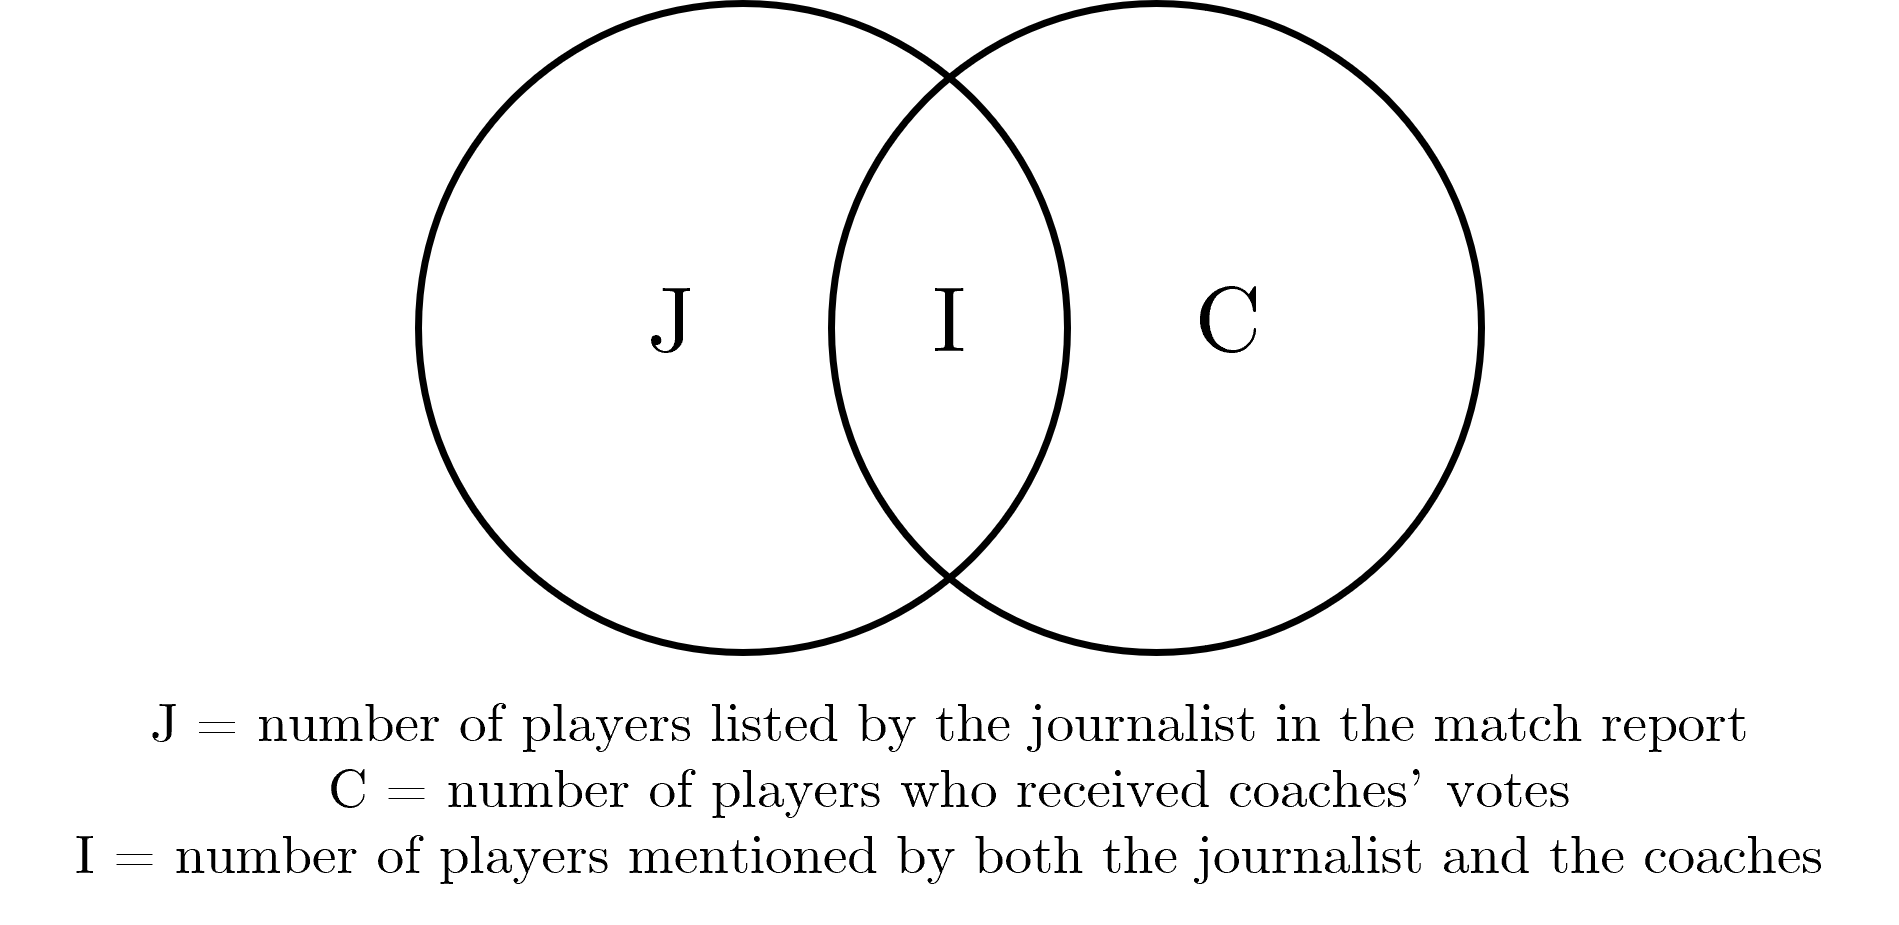
Let’s go through each of the metrics.
Strike Rate
The strike rate – which was the question I focused on last year – is probably the simplest way of looking at the data. The strike rate asks:
“When a journalist said a player was among the best, how often did the coaches agree?”
Or, for the mathematically inclined:
Let’s look at the Opening Round clash between Sydney and Carlton as an example. Sarah Black, who covered the match for AFL.com.au, named 10 “best” players in her match report. And come Monday, the coaches acknowledged six players in their votes. Five players appeared on both lists.
Therefore, Sarah’s strike rate for this match was:
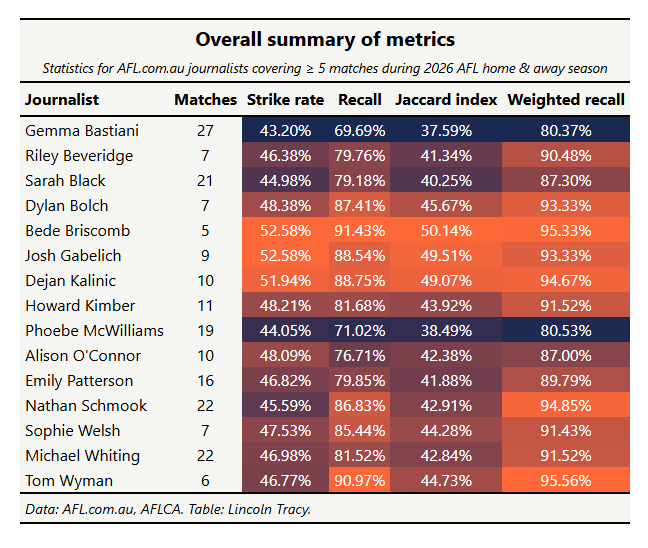
Despite changing the analytical approach, Gabelich once again finished the season with the best strike rate (52.58%), tying with Bede Briscomb. The pair were less than one percent ahead of Dejan Kalinic, with a slight gap to Dylan Bolch and Howard Kimber.
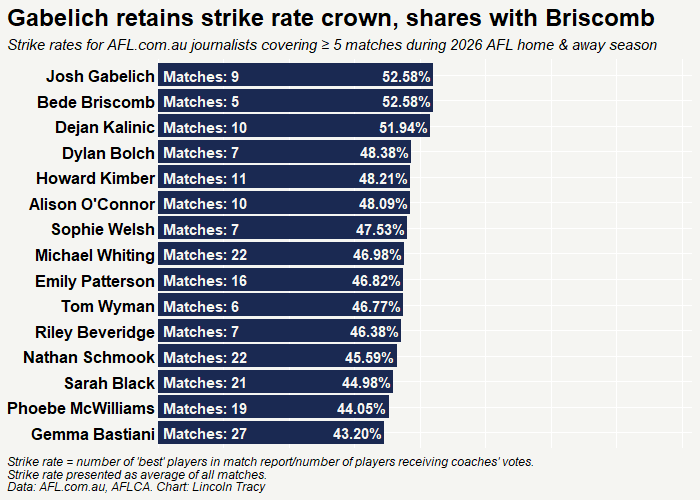
However, as I mentioned earlier in the piece, the strike rate doesn’t penalise the journalist for missing players that the coaches gave votes to. This is where the second metric comes into play.
Recall
The recall (or coverage) solves the asymmetry of the strike rate. It asks:
“Of all the players the coaches gave votes to, how many did the journalist identify?”
The coverage formula is like similar to the formula for the strike rate, but has a different denominator. Rather than using the number of players listed by the journalist in the match report, it uses the number of players the coaches award votes to.
Continuing with the example I used in the strike rate section, five of Sarah’s 10 “best” players in the match report were “endorsed” by the coaches in their votes. Therefore, Sarah’s coverage from the first game of Opening Round is:
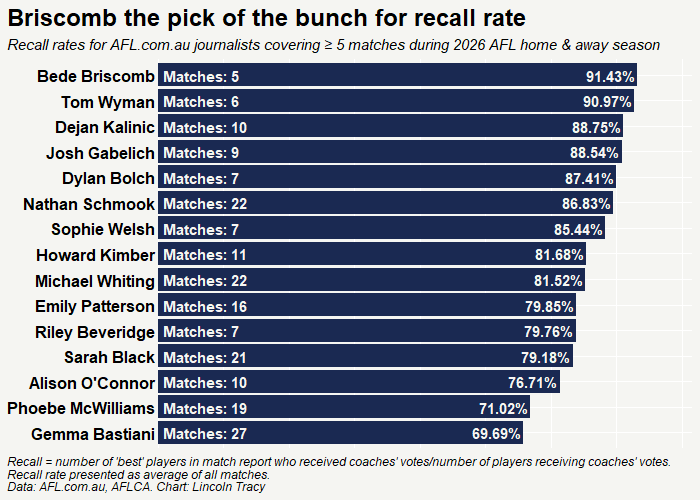
The recall value is a noticeable improvement from the strike rate, and an expected one given the change in the denominator used to calculate this metric. Briscomb again features at the pointy end of things, just edging out Tom Wyman, while Kalinic and Gabelich also performed strongly.
Jaccard Index
The Jaccard Index is another, albeit slightly more complicated way, of looking at the similarity between two datasets. It asks:
“What is the proportion of players identified by either source that were identified by both sources?”
The formula looks like this:
But this translates to the number of players appearing in both lists divided by the number of players appearing in either list. Asa result, the formula can be rewritten as:
Using this equation for the Opening Round example, we get:
The Jaccard index in this example isn’t as high as the coverage due to the number of names that appeared in Sarah’s match report who were not included in the coaches’ votes.
This trend is reflected when we look at the data for the entire season more broadly, with only one journalist (Briscomb) attaining a Jaccard index exceeding 50%. The numerator in the formula for the Jaccard index remains the same (i.e., the number of players mentioned by both the journalist and the coaches).
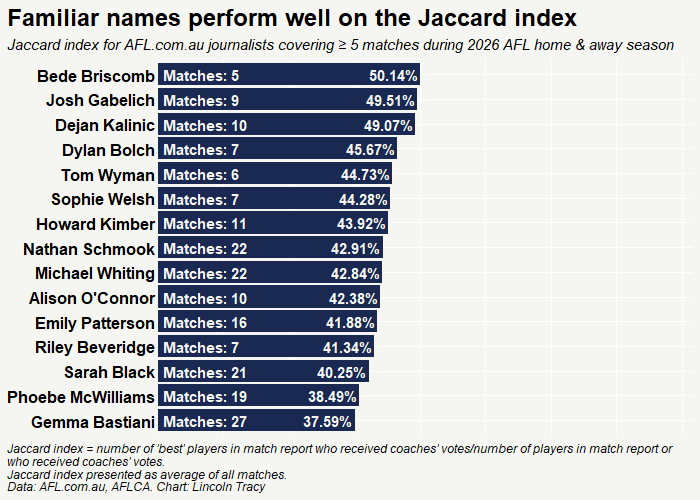
Like with coverage, the denominator changes. But instead of reducing the value of the denominator, it increases because it accounts for the total number of players listed by the journalist as well as the number of players listed by the two coaches.
Journalists tend to list at least four “best” players from each side in their match report, but it’s not often that eight or more players receive coaches’ votes. As a result, it’s unavoidable that the similarity of the two lists decreases.
Vote-weighted Recall
Finally, we have vote-weighted recall, which asks:
“Did the journalist identify the players that the coaches rated most highly?”
This metric takes the number of coaches’ votes into account – meaning journalists who consistently identify players who receive eight or more coaches’ votes are rewarded more than those who only list players who receive a smaller number of votes.
The relevant formula is:
As mentioned earlier in the piece, during the Swans/Blues clash back in Opening Round, Sarah named 10 players, the coaches handed out votes to six, and five were on both lists.
Specifically, she included Justin McInerny (10 votes), Errol Gulden (eight), Isaac Heeney (five), Sam Walsh (three), and Chad Warner (one) in her match report, but missed Tom McCartin (three votes).
Therefore, Sarah’s vote-weighted recall from this game is:
Wyman, Briscomb, Kalinic, and Gabelich appear at one end of this graph. The quartet are joined by Nathan Schmook, AFL.com.au’s man in the west.
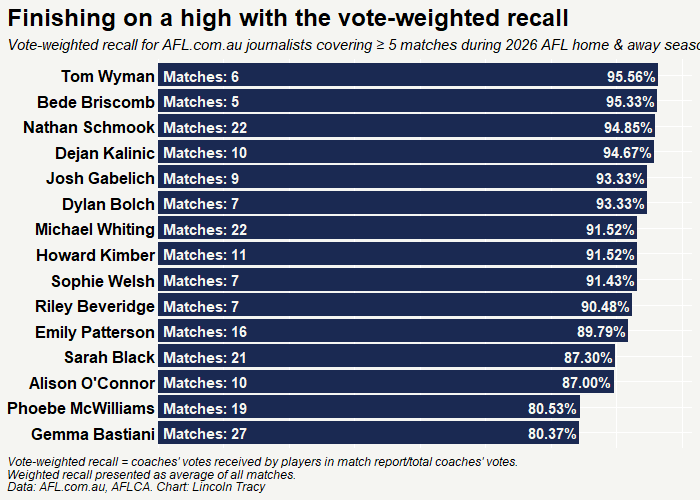
It would be interesting to take vote-weighted recall a step further and whether the journalist’s ordering of the “best” players matches that of the coaches. Unfortunately, this is not possible. The journalist separates the “best” players by team where the coaches’ votes are one single list.
Conclusion
As a parting statement, please remember that these metrics should not be construed as a suggestion that one journalist is better than another or knows more about the game of Australian rule football. This is purely an academic exercise I have undertaken over the past two seasons because it’s a question that I think is interesting.
(If you’ve already forgotten, last week I wrote about how I’d tracked all the names Damian Barrett mentioned in his Sliding Doors column this year. I’m starting to think I might need a new hobby. Or I should try to get out more in 2027.)
I’ll quote myself directly from last year:
“The performances of all the match reporters are very respectable when you think about what the two opposing coaches may consider when handing out their votes. I feel it could be very difficult to have a good idea of what one coach is thinking at any given point in time, let alone two.”
I can’t blame any of the staff from AFL.com.au for not wanting to have to think like Luke Beveridge, Damien Hardwick, Ross Lyon, or any of the more “colourful” coaching identities currently in the league. Everyone is entitled to their own opinion.
And when you consider how often the coaches disagree on who should get votes, or you think about how much airtime is given to the Brownlow each year when an umpire goes against the “popular” vote, the bit about everyone getting their own opinion really rings true.
It’s also important to acknowledge that most of the journalists who performed “better” on these metrics covered fewer matches than other journos. Therefore, it’s entirely possible that performance would decrease as the number of matches they covered increased.
I reduced the threshold for the number of match reports a journalist needed to write to be included in this year’s analysis, and I’m still not sure whether this was the right decision. On the one hand, lowering the threshold increases the number of journalists included in the analysis. But on the other hand, it introduces the potential for the “noise” I mentioned in the previous paragraph.
Sarah Black naming ten players for Sydney v Carlton, with five matching the coaches' six, shows neatly why recall and strike rate can tell such different stories. Gabelich and Briscomb tying on 52.58%, with only Briscomb clearing 50% on the Jaccard index, suggests the hobby should stick. A narrator reads out everything I publish about Karratha, handy if your eyes have had enough numbers. All my articles: https://lukeybkarratha.substack.com/archive
Interesting exercise, Lincoln. I’ve reported on elite sport for years, and I wonder whether the disagreements tell us as much as the agreements. Journalists are explaining a contest to an audience. Coaches are judging performances against roles, expectations and tactical instructions that often can’t be seen from outside. I’d be less interested in how closely journalists match the coaches than in what the gaps say about how performance is valued.