Thrillers and Blowouts
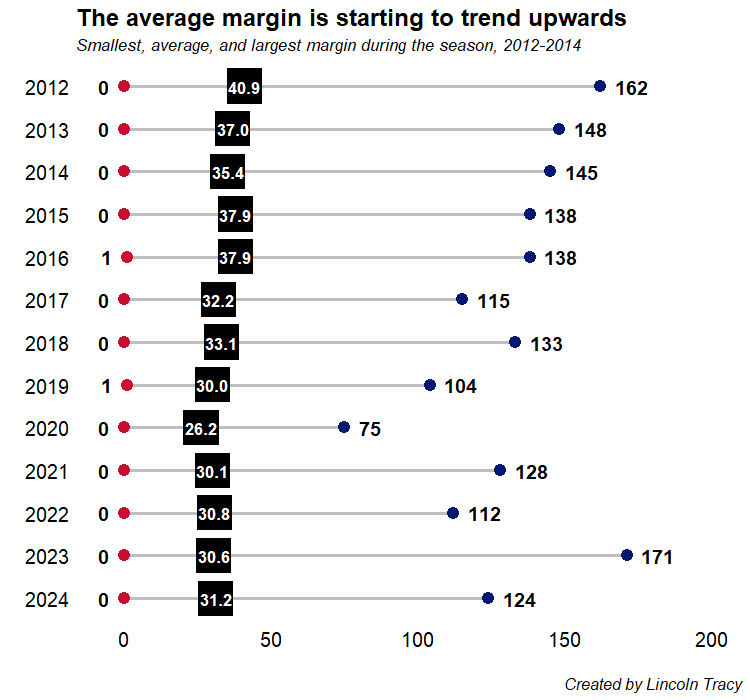
After eight straight seasons of the average AFL margin decreasing, the last four have seen a slight increase.

Earlier this week Dejan Kalinic published a story on the AFL website about how the 2024 AFL season “delivered more thrillers than ever before”.
There were 216 games played this year, with 59 being decided by 10 points or less (27.3% of all games this season).
This is an increase from the 57 games decided by a similar margin in 2023, and the 42 that occurred in 2022.
But as Dejan points out:
“The introduction of Gather Round has made the past two seasons longer than ever before”
So, it’s potentially a little unfair to just look at the raw numbers, given the number of games played over the course of a season has fluctuated over time.
While the proportion of games this year that were decided by 10 points or less is well short of the all-time record (12 of 28 games, or 42.9%, in 1916), it is the highest is has been since the AFL moved to an 18-team competition in 2012.
You would think that as the proportion of close games goes up, the average margin seen over the course of a season would also decrease.
As we can see from the figure below, this was the case from 2012 (where the average margin was 40.9 points) to the covid-shortened season of 2020 (where the average margin was 26.2 points). There was also a corresponding decrease in the largest recorded margin during this time.
he first few seasons of the AFL’s 18-team era were marked by frequent blowouts against the expansion clubs (Gold Coast and Greater Western Sydney), although Melbourne were also poor performer during this time.
Between 2012 and 2015 the Giants and Demons registered 14 and 5 losses of 100 points or more, respectively. The Suns only had one loss of this margin during that period but lost 20 games where the final margin sat between 50 and 99 points.
However, the last four seasons has seen the opposite trend, with the average margin jumping back above 30 points and continuing to climb.
The steady increase in average margin over the past few years may be explained by the increase in the proportion of games decided by 51-80 points (up to 17.2% of games in 2024 compared to 12.1% of games in 2021).
North Melbourne and West Coast, teams who have struggled over the last few years, have notched up 23 and 18 losses of 51-80 points since 2021.
But the proportion of games where the margin exceeded 81 points has varied over the last four years but remains relatively consistent: 4.8% in 2021, 3.9% in 2022, 5.6% in 2023, and 4.7% in 2024.
It will be interesting to see whether this slightly counterintuitive trend continues in 2025.
Thanks for reading! The timeframe of this stat is limited based on what data are freely/easily available and/or accessible. Please don’t hesitate to contact me if you spot any errors in what I have presented.


