


We have all the time (on) in the world
Time enough for the game to unfold

Earlier this month The Age’s Scott Spits wrote an interesting piece about how the average length of each quarter has been slowly increasing over time.
Based on data for the first six rounds of the season, quarters were lasting more than 32 minutes each, meaning the average AFL match took almost 130 minutes to complete.
I won’t back over the entire article – including his exploration of some of the potential reasons as to why games are longer than ever before – but my eye was drawn to one particular section.
The part in question related to a social media post made by Geelong skipper (and then AFL Players Association president) Patrick Dangerfield earlier this year.

I found the timing of Spits’ story and the reference to Dangerfield’s social media post interesting, as less than a week before the story was published Geelong had taken full advantage of longer quarters in their Gather Round clash with Adelaide.
The Crows led by 24 points after Jeremy Cameron kicked a behind in the 30th minute of the second quarter – but this lead was cut to 12 points after Jack Bowes and Cameron goaled in the 32nd and 33rd minutes of the quarter (which ran for 34 minutes).
Adelaide’s lead was reduced even further when Max Holmes kicked the first of the second half, just 20 seconds into the third. The Cats continued strongly from this point, kicking eight goals to four to win by 19 points.
This series of events got me thinking about which teams have taken full advantage of the longer quarters this year – by scoring more heavily in “time on” compared to the “actual” quarter (the first 20 minutes).
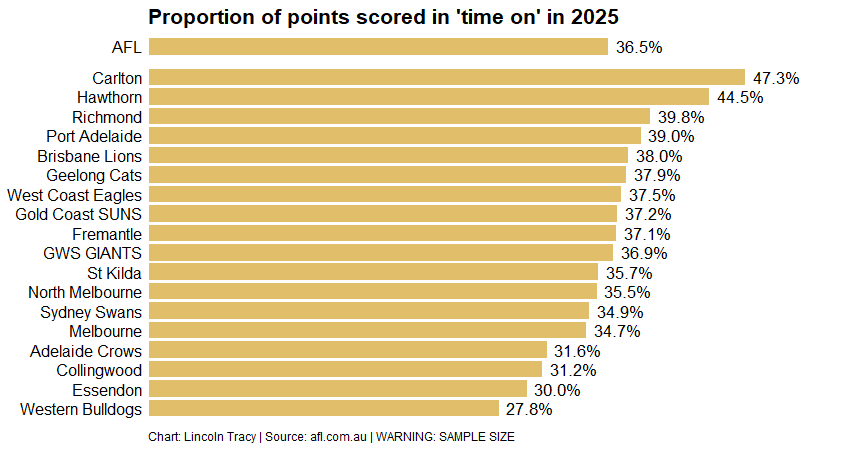
Looking at all matches to the end of Round 6, the average quarter length is a tick over 32 minutes. Therefore, “time on” accounts for about 38% of each quarter. Thirty-seven percent of scores have occurred after the 20-minute mark of each quarter.
Geelong have registered 54.42.366 in regular time and 33.25.233 in extra time, which translates to 37.9% of their points scored beyond the 20-minute mark. This ranks them sixth, behind Carlton, Hawthorn, Richmond, Port Adelaide, and Brisbane.
The Western Bulldogs rank last, with only 27.8% of their points scored in time on, behind Adelaide, Collingwood, and Essendon.
Comparing the data on a quarter-by-quarter basis also reveals some interesting insights.

For example, Carlton score more than half of their points in the first and third quarters in time on than the second and fourth quarters, while Hawthorn are score much more heavily in time on during the second and third quarters.
In contrast, West Coast score an increasing proportion of their points in time on as the match progresses, peaking at 55.4% in the fourth quarter. A flurry of late consolation goals when their opponents have put the cue in the rack, perhaps?
However, scoring points is only half the battle. Having a high-powering offense in the dying stages of a quarter may mean little if your defence leaks like a sieve. This is where looking at the net difference in points scored versus points conceded comes into play.

Hawthorn and Carlton remain the top two teams (albeit the positions have switched) in terms of dominating scoring during time on. The Hawks score 44.5% of their points and allow their opponents to score 31.1% of their total during time on (+13.4%), defending slightly better than Carlton (47.3% versus 36.1% for their opponents, +11.2%).
Similarly, Essendon and the Western Bulldogs find themselves at the bottom end of the scale, conceding a greater proportion of scores in time on compared to what they can put forward themselves.
And while St Kilda are slightly below league average in terms of the proportion of points scored during time on (35.6%), they are ranked third in the above chart due to their impressive ability to not concede scores during the same period. To this point in the season the Saints have allowed opponents to register 27.5% of their score in time on – clearly the lowest in the league.
Looking at the quarter-by-quarter breakdown again reveals some interesting insights.

Essendon’s and Adelaide’s poor record in time on is heavily influenced by their performances in the first and second quarters, respectively, while Hawthorn and St Kilda are much more dominant on the scoreboard compared to their opponents just before the half-time break.
Geelong’s performances in time on during the second half are a real chalk and cheese comparison, but these results are most likely influenced by their Round 1 victory against Fremantle. Young Docker Murphy Reid went on his four-goal blitz in time on during the third quarter, kicking goals in the 23rd, 26th, 28th, and 29th minutes, before the Cats kicked six goals to none during time on in the last quarter (Oliver Henry and Cameron kicked two each, with Bailey Smith and Sam De Koning kicking one).
And if we focus on the two Western Australian teams, the data confirm that West Coast do indeed score a larger proportion of their points late in the final quarter relative to their opponents – which almost balances out the scores they concede in time on during the previous three quarters – while Fremantle allow their opponents to score a greater proportion of their total during the same time period (as alluded to in the previous paragraph).
The Western Bulldogs have also performed poorly in time on of the last quarter, although this is heavily influenced by their loss to the Brisbane Lions at Norwood Oval. The Lions kicked four goals to one after the 20-minute mark as they ran out 21-point winners.
It will be interesting to track the breakdown of when teams score over the rest of the season, as a series of poor performances late in quarters could be the difference between playing finals or starting the off-season early.
Super read Lincoln. Plenty of insightful nuggets within the piece.