Why Patrick Cripps should be happy to see Jacob Mollison tonight
Some umpires appear to have given Cripps a leg up in the Brownlow voting last year – but they weren’t the only ones potentially playing favourites.
Last year Patrick Cripps won his second Brownlow Medal with a whopping 45 votes, seven clear of Nick Daicos (38) and 16 ahead of Zak Butters (29).
Both Cripps and Daicos bettered the previous record for the highest number of votes awarded in a single season under the current 3-2-1 system – 36, set by Dustin Martin in 2017 and Ollie Wines in 2021 – but did so in different ways.
Cripps polled in 17 of his 23 games, receiving three votes on 12 occasions, two votes in four games, and one vote in one game.
Daicos was awarded votes in 18 games: three votes in seven games, two votes in six games, and one vote in five games.
These totals were well beyond what a consensus of 12 different Brownlow Medal predictors thought would happen – but this wasn’t unique to the Carlton and Collingwood superstars.
Using data provided by Tony Corke (from Matter of Stats), we can see that most of the players who finished in the top 10 of the 2024 count ended up polling more votes than they were predicted to.
The two real exceptions to this were Sydney pair Isaac Heeney – who was widely considered a favourite before his suspension in Round 17 – and Errol Gulden.
As you can see from the table above, Cripps had the largest difference between his predicted and actual votes (13.0) for any player, not just those in the top 10. This averages out to receiving 0.56 more votes in each of the 23 games he played over the course of the season – the most of any player who played at least six games.
On the other end of the spectrum, Brodie Grundy was potentially the most ignored (or most overhyped, depending on how you want to look at it) player, receiving 7.3 fewer votes than predicted (8.3 versus 1), ahead of Noah Anderson (19.7 predicted, 14 received, -5.7 difference) and Marcus Bontempelli (24.3 predicted, 19 received, -5.3 difference).
The results from the Brownlow Medal generated a lot of discussion about the number of players who received more votes than they were expected to – particularly in games where their performance wasn’t deemed (by the predictors and the public) to be worthy of being awarded votes.
Part of this discussion involved Tony asking whether we could tie the games where there were odd-looking votes to specific umpires. And we can, as umpire and Brownlow vote data are recorded by AFL Tables, which is an incredibly handy resource for exercises like this.
By combining the data available through AFL Tables with the Brownlow prediction models provided by Tony Corke – which includes a breakdown of votes on a game-by-game basis for every player in the league – we can compare the predicted and actual votes and cross-reference these with who was officiating each game.
In the case of the Carlton skipper, there were 10 games where his predicted and actual votes differed by more than 0.5 votes (which I will admit is an arbitrary cutoff, but I feel it is appropriate for the purposes of this exercise).
Cripps received a higher number of votes than expected in nine of these games, and received fewer votes than expected in the remaining game.
There were 23 umpires involved in these 10 games, with eight of the games involving at least two of a subset of 10 umpires who were involved in more than one of these 10 games, as indicated by the coloured rectangles in the table below.
We can see that specific umpires were involved in more games where the five-time John Nicholls medallist received more votes than he was predicted to, with the likes of Matt Stevic, Jacob Mollison, Hayden Gavine, and Rob O’Gorman appearing on multiple occasions.
And while Mollison and Stevic both, on average, awarded Cripps more than 1.5 votes per game than he was expected to receive, they weren’t the worst offenders1.
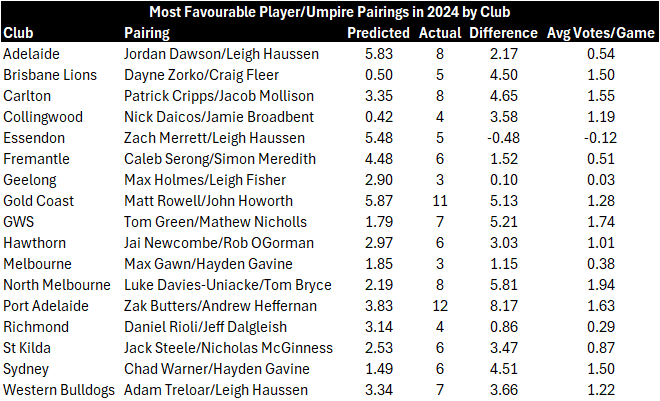
Among umpires who officiated at least three games for a particular player, Tom Bryce was involved in games where North Melbourne’s Luke Davies-Uniacke received an average of 1.94 votes above what was predicted, while Matthew Nicholls was involved in games where Tom Green received an average of 1.74 votes above what was predicted.
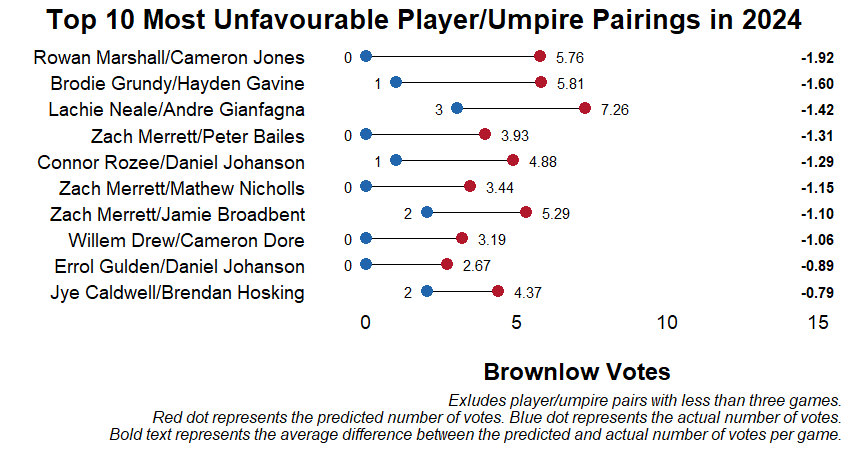
Similarly, there are umpires who were involved in multiple games where a player received fewer votes than predicted. Essendon fans may want to avoid looking at the following figure.
The tables below display the most and least “favourable” player and umpire pairings for each club2. Similar to the Cripps data from earlier, there are a few repeat offenders on these lists.
1 It’s important to note that these figures should be interpreted with caution. The four umpires award Brownlow votes as a group, not an individual, so it’s a little unfair to make a direct 1:1 comparison. But due to the number of umpires across the league, where they are located, and how their schedule/roster rotates, there are a limited number of occasions where two or more umpires officiate together more than once or twice, which makes it challenging to look at how sets or groups of umpires award votes. You could also argue that the Brownlow predictor models are not accounting for something that the umpires consider when allocating the votes, but I feel this is veering into a Moneyball style situation of analysts butting heads with baseball scouts about how to scout and assess players. We know that Brownlow voting is an imperfect science, but it’s still interesting to look at things like this.
2 Certain clubs only had one player where there was an umpire involved in three or more of their games.


Ripping read Lincoln